fundit.pro
Back to Home
⚠️
Note: Vanguard has no API to query nor are managed funds public, they are privately traded with Vanguard.
We ask you to please check this price data from either Vanguard or Morningstar who report on it. I am not currently paying for a Morningstar API subscription. These managed funds will not reflect an accurate price until you manually update it below.
Manual Prices for Managed Funds
We identified the following managed funds in your portfolio allocation. Please check the current trading prices and enter them below:
| Product ID | Name | Manual Price ($) |
|---|
Portfolio Allocation
| Product ID | Quantity | Current Price | Total Value |
|---|
Portfolio Breakdown
This graph displays the proportional allocation of your current Vanguard portfolio.
Total ROI by Investment
This chart shows your total return on investment for each asset, calculated using a dollar-cost averaging approach from all your transactions (buys, sells, DRPs).
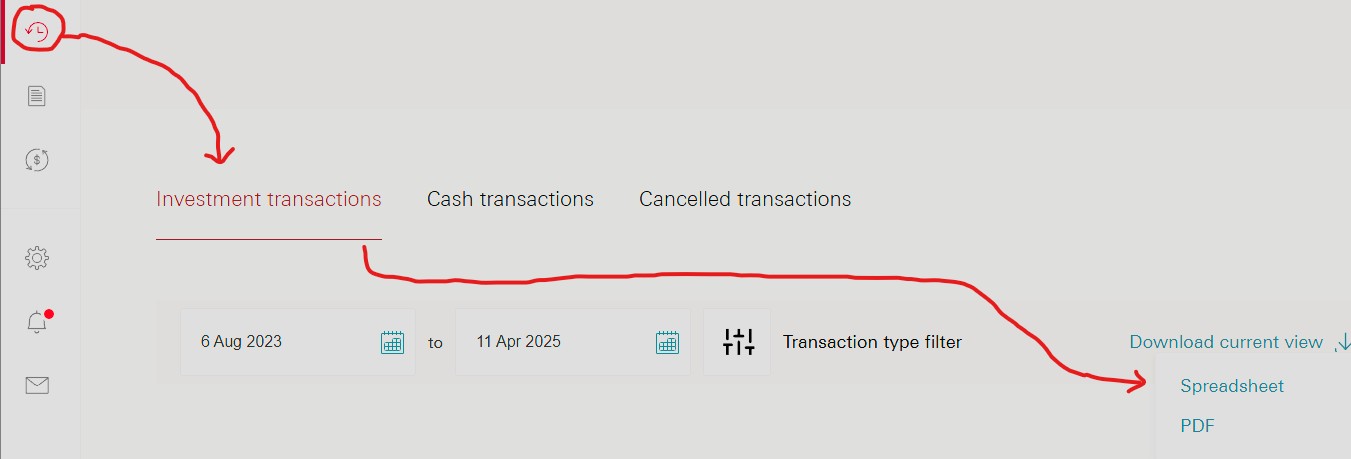
Cash Transactions:
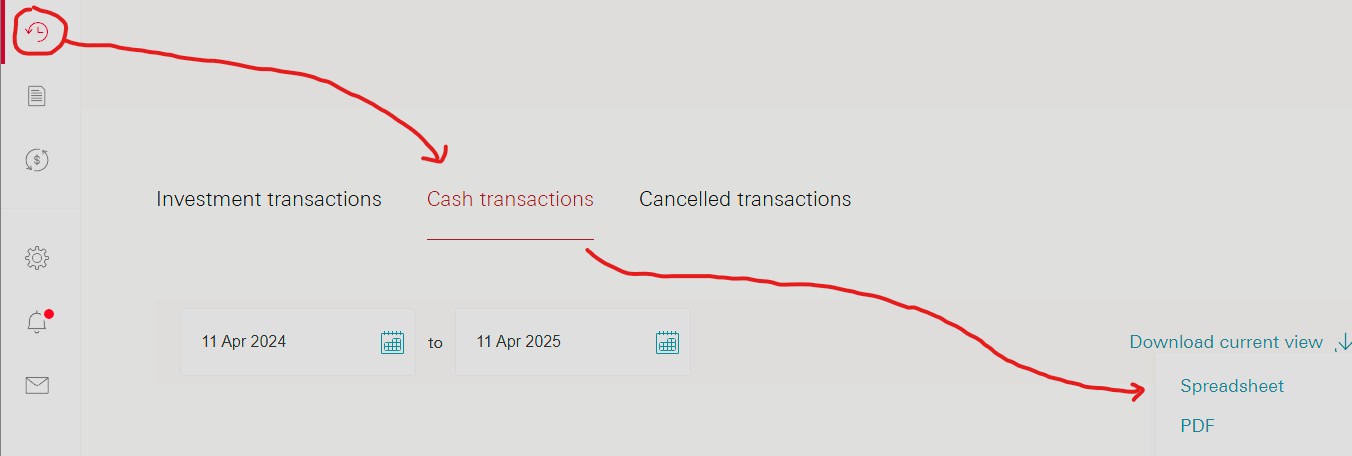
Investment Transactions: